 |
| http://www.sodahead.com/ |
SP4: Analyzing and interpreting data
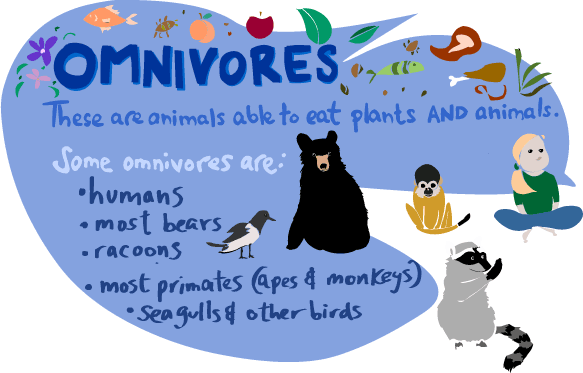
This week in class we analyzed data by reasearching on a website with 6 certain items that would help us with out reasearch of Vegetarians and Omnivores. We interpreted data by creating a T-chart for both Omnivore and Vegetarian, and their pros and cons. We are going to put this data into a essay.
No comments:
Post a Comment